- +91-11-4044-5999
- info@cdri.world
-
Copernicus Marg, New Delhi, INDIA
Framework for Evaluating Bridge Network Resilience by Considering Socio-Technical Attributes
Dr. Rubel Das, Dr. Masaaki Nakano and Mr Tetsuro Goda
Nippon Koei Co. Ltd, Research and Development Centre
Abstract: Transportation bridges are the weakest element among all the components of the transportation infrastructure system. Recent experiences with natural and man-made water-related disasters indicate that the current transportation systems cannot protect and prevent all disruptive events. The focus is gradually shifting from critical infrastructure protection to critical infrastructure resilience because the former does not address all the aspects of securing a country’s critical infrastructure.
In this study, structural properties are considered explicitly while the interdependency of bridges is being analyzed. The failure of one bridge may not significantly influence the network-level performance. Other bridges will have users. However, the disruption of another bridge may produce a substantial hindrance. In that case, a collapsed bridge’s frequent users have no alternatives to reach their destination. Therefore, it is necessary to evaluate the interdependency and importance of each network section. Certain destinations can be reached via multiple routes, whereas others have only one route.
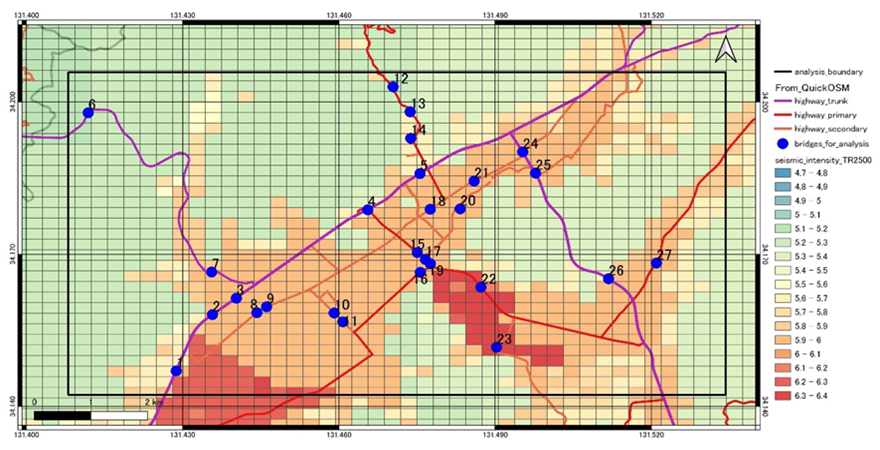
Therefore, this study assesses resilience through a network-level analysis. Structural and traffic factors were combined into a single framework by utilizing structural assessment for each bridge and the operational performance of transportation networks. The concepts presented were applied to a real transportation network in Yamaguchi, Japan, to illustrate the mathematical procedures. The proposed method is based on the concept of 4R (robustness, redundancy, rapidity and resourcefulness). In this study, the location data for Yamaguchi city was used, which contains many transportation bridges. A return period of 475 years is utilized to estimate the bridge damage levels. The damage level of bridges owing to earthquakes can be estimated using the flowchart proposed by Kobayashi and Unjoh (2005). According to that study, the condition of bridges can be categorized into three damage levels. The result for a return period of 475 years has two bridges with damage level “A,” 17 bridges with damage level “B,” and eight bridges with damage level “C”. Meanwhile, the result for a return period of 2,475 years has six bridges with damage level “A,” 14 bridges with damage level “B,” and seven bridges with damage level “C”
For the project, the bridge with the largest number of users was selected, thus reducing the travel cost. Here, three restoration strategies were analyzed: (1) road-user priority scenario, (2) road-type priority scenario, and (3) damage-type priority strategy. In scenario 1, the average speed after the restoration of bridges increased. The average speed for scenario 2 on the 10th day was higher than that for the other periods. The average speeds on the fifth and 15th days were lower than in the base case. Without a variation in scenario 3, the average speed after the restoration of bridges was higher than the base level, except on the 30th day.
The findings reveal that scenario 1 has the lowest area above the resilience curve. Although the areas above the curves for scenarios 2 and 3 are significantly close, for scenario 3, they are the largest. Based on the area, the pre-disaster user-based scenario (scenario 1) produced a more resilient system. Based on the above results, pre-disaster maintenance results in less severe damage, and post-disaster recovery is faster. Thus, it can result in a trade-off between pre- and post-disaster costs.
 in floating community space (fls) in the peruvian amazon.jpg)

 for infrastructures based on disaster.png)
